Fire Hazards Of Polyurethane Foam
 Polyurethane foam fires are known to produce very high heat release rates and extremely toxic fumes. As a result, these types of fires provide some unique life, firefighter, property safety and fire suppression challenges. In this study polyurethane foam fires and their combustion processes are investigated using the Fire Dynamics Simulator. The software tool’s predictions were validated against test results from experimental burns. Comparisons between simulation and fire tests demonstrated unprecedented good correlation. This formed the foundation of this study validating the model and providing reliable insights into the nature and sequence of the various combustion events taking place.
Model predictions will be used to evaluate the effects of polyurethane foam fires against the capacity of fire protection systems such as impact of smoke development or sprinkler activation times.
Update, September 2015: Since the publication of this article, the investigation of PUF fires was extended to gather additional insights into their combustion behavior and associated combustion processes. Updates to this article are discussed in more detail below, see bottom of this page.
Introduction
Polyurethane foam (PUF) based products are used in a myriad of household items, such as mattresses, upholstery, bedding, and kids playpens. As a result they have become commonplace not only in residential, but also in warehousing and commercial settings.
Under fire conditions these types of products are known to produce very high heat release rates that, in turn, can present considerable challenges for firefighting, as well as for fire and building safety. In particular the impact of fire growth and smoke development of PUF fires and its effect on sprinkler activation times and smoke control systems is of interest in evaluating the capability of fire protection systems.
Use of Computer Aided Fire Simulation
Computer aided fire simulation is often a highly economical and feasible method in analyzing fires for a particular scenario and set of conditions. However, fires and their associated combustion processes are based on physically complicated and complex phenomena. Therefore, using Computer Fluid Dynamics (CFD) tools requires a good deal of understanding of all of the physical processes involved.
At the same time it is important to know the limitations of the applied numerical procedures. However, when fire scenarios are modeled correctly, the final predictions have the potential to come very close to actual fire outcomes. The predictions of these models then can be used to explain the sequence and occurrence of the various events during the combustion process, as well as their impact on the surrounding environments. This often provides insight that otherwise cannot be obtained.
FDS, short for Fire Dynamics Simulator, is used in this study and is one of the leading CFD software tools in the fire protection industry. It is specifically developed to investigate a wide range of fire scenarios.
Objective and Approach
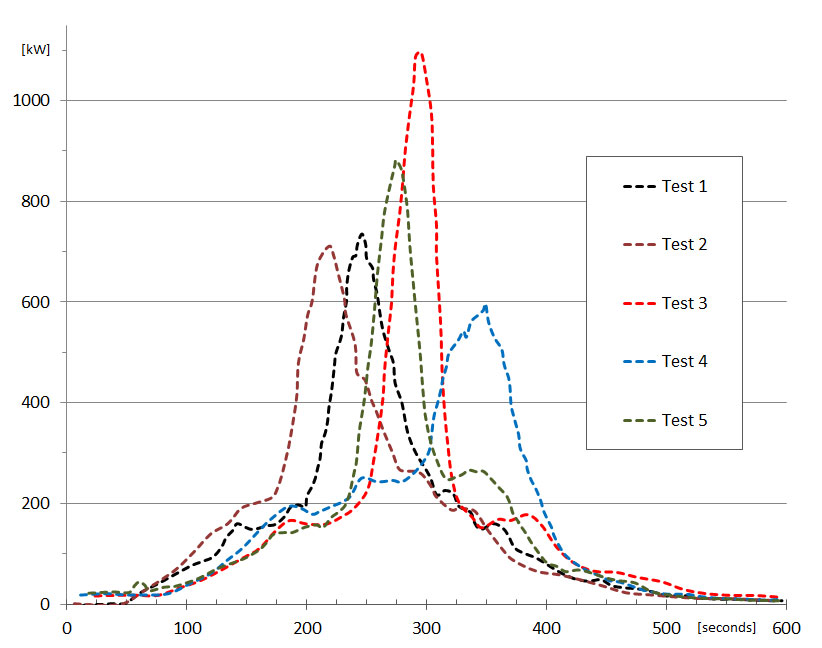
Figure 1. NIST Fire Tests: Heat Release Rates.
(Click To Zoom)
NIST performed the experimental burn tests1 on 4-inch (10-cm) thick by 4 ft x 4 ft (1.2 m x 1.2 m) wide polyurethane foam slabs. Results from these burn tests are used for comparison with the model developed to simulate flame spread, heat fluxes, and smoke development over time (Figure 1).
The Model
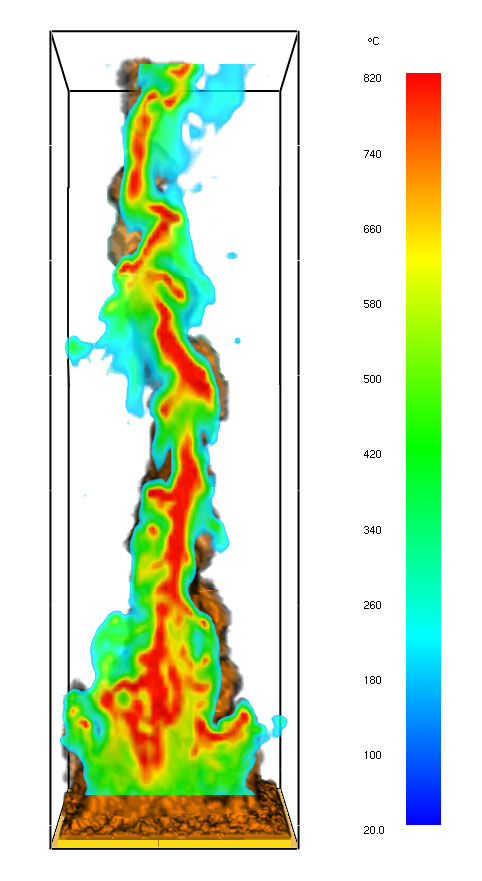
Figure 2. Flame Front And Temperature Profile Along The Center Line During Polyol Burn. (Click To Zoom)
A computational fluid dynamics (CFD) model is developed that is based on FDS Version 5.5. FDS is a low Mach number CFD software tool. In other words, only fires and not explosions (deflagrations or detonations) can be modeled. When modeling PUF fires, it is necessary to closely look at the manufacturing process of PUF to better understand some critical details of the combustion process. During fabrication/production essentially two main materials are used to create the foam:
· Isocyanate (typically toluene diisocyanate, TDI)
· Polyether Polyol.
The proportions of these two materials are approximately one third TDI and two thirds Polyol. Commercial foams can also contain other ingredients, such as surfactants and fire retardants. In effect, these additional ingredients may affect the physical and combustion properties of the PUF.
During the combustion process the foam decomposes into its initial constituents, namely TDI and Polyol, and eventually char. For this study commercially available, flexible, non-flame retardant polyether polyurethane foam was used in the experimental fire tests1. Material properties were obtained from small-scale (micro-calorimeter) experiments performed1 and from literature.
Table 1. Material Properties of PUF
| Property | Polyurethane Foam | Toluene Diisocyanate | Polyether Polyol |
|---|---|---|---|
| Density | 27 kg/m3 or 1.7 lb/ft3 | 1210 kg/m3 or 75.5 lb/ft3 | 1012 kg/m3 or 63.2 lb/ft3 |
| Heat Of Combustion | 27100 kJ/kg or 11660 BTU/lb | 9600 kJ/kg or 4130 BTU/lb | 17500 kJ/kg or 7530 BTU/lb |
Based on the material properties in Table 1, a multi-layered, dual-material model is developed for this study (i.e. stacked uniform layers of TDI and Polyol are modeled). The number of cells applied in the FDS models during development ranges from half million to four million cells. The simulations are performed on a dedicated computer with twelve Intel XEON processors using the parallel computation version of FDS.
Initial modeling efforts included the simulation of the combustion process for each of the single combustion materials, TDI and Polyol respectively. This step proved to be crucial in creating a realistic starting point for assembling an essentially two-phase combustion model simulating the PUF decomposition back into TDI and Polyol when ignited.
Discussion of Results
For purpose of this discussion the entire combustion process is separated into three phases.
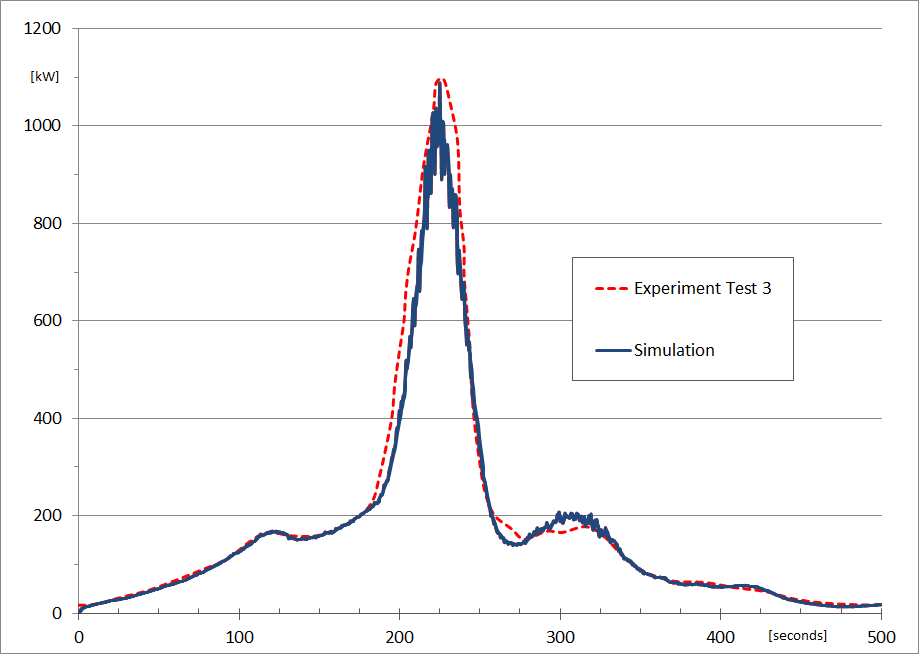
Figure 3. Simulated And Fire Test Heat Release Rates.
After ignition of the PUF slab along one edge of the slab, the fire spreads radially outward. From experiments1 in burning PUF, it is known that TDI will burn first and after it is consumed, Polyol will start to combust. During the burn in this phase the heat release rates are slowly increasing, and then leveling off when the beginning of the Polyol combustion phase is reached.
At approx. 180 sec and a heat release rate (HRR) of approximately 0.68 million BTU/hr (200 kW) (Figure 3), the predicted flame front has spread across the surface of the foam and the fire fully engulfs the slab. In the center area TDI has burned off and parts of the Polyol layer are now exposed and combust, though they have not yet started to release much of their stored energy. Fire test observations1 demonstrate that parts of the foam have collapsed and a ‘melt layer’ is left at the bottom of the pan. During this phase smoke development gradually increases and smoke quickly fills the control volume (Figure 5).
Polyol Combustion
Once much of the TDI is consumed, a large amount of Polyol has formed. Polyol further combusts and now fully releases its energy. This high heat release combustion phase lasts from approximately 180 seconds to 260 seconds (Figure 3). Maximum-recorded HRR values in the fire simulations are around 3.7 million BTU/hr (approx. 1070 kW to 1110 kW). These predicted values lie well within the range for the HRR’s measured during the experimental fire tests i.e., measured values range from approximately 2 million BTU/hr to 3.7 million BTU/hr (600 kW to 1100 kW, Figure 1).
Polyol burns so hot that it, in effect, creates a ‘fire column’ of flames with intense heat (Figure 4). The model predicts the flame front momentarily approaching over 14 feet in height with flame temperatures reaching up to 1500 degrees Fahrenheit (approx. 820 degrees Celsius, Figure 2). A peak heat flux density (heat rate per unit area) of 0.2 million BTU/hr/ft2 (760 kW/m2) is calculated. The smoke development parallels the heat release development in that it further increases, peaks, and then decreases during this phase. There is still unburned PUF by the time the second phase of combustion has completed.
Post Polyol Combustion
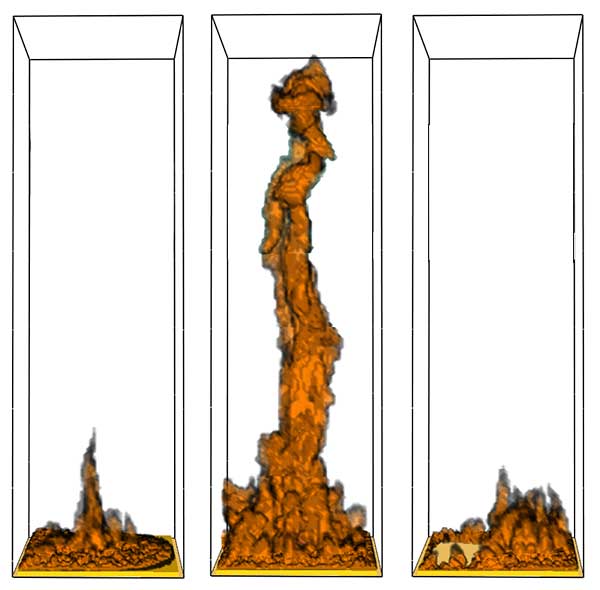
Figure 4. Flame Front Development (Smoke Is Excluded) For Time Indices 150 sec, 220 sec, And 300 sec. (Click To Zoom)
The remaining PUF (eventually decomposing into TDI and Polyol) will burn for some time afterwards (260 sec – 500 sec) during which time still considerable amount of heat is generated. However, due to the rather small amounts of PUF combusting (at the start of this phase approx. 10% of total available TDI and Polyol), the total heat released is much smaller when compared to the previous phase. Nevertheless, heat release rates of up to 0.5 to 0.7 million BTU/hr (150 kW to 200 kW) are still reached (Figure 3). During this phase flame heights and smoke development slightly rise initially (trending the small rise in heat release) then diminish until the fire self-extinguishes.
FDS Specific Observations
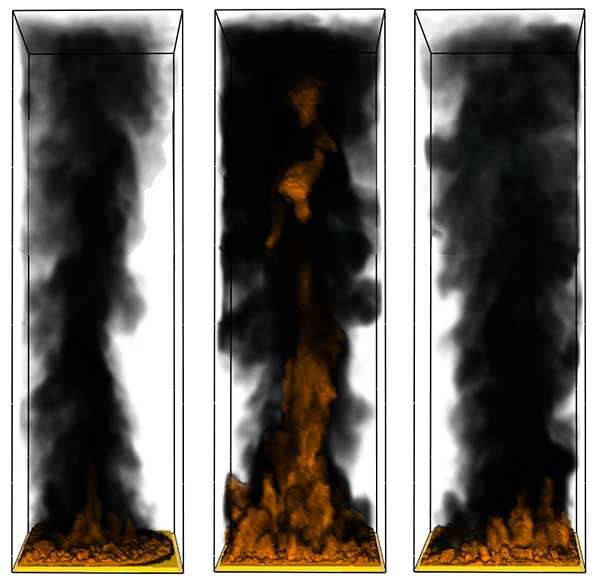
Figure 5. Smoke Development With Open Boundary Conditions i.e., Smoke Does Not Accumulate In The (Ventilated) Control Volume For Time Indices
150 sec, 220 sec, And 300 sec. (Click To Zoom)
The simulation model incorporates two distinctively different combustion models, one for solid fuels and one for liquid fuels. Considerable amount of effort was spent in “marrying” the two combustion models. It can easily be shown that the solid fuel model is quite capable in accurately predicting the fire dynamics of the single constituent TDI, and the same can be said about applying the liquid fuel model for Polyol.
However, once the two individual models are combined into a single model, it becomes apparent that the interaction of the combustion processes is more complicated than the models for each of the individual constituents suggest. As a case in point, Polyol under high temperatures burns right away, in contrast to lower temperatures where the start of the high heat release combustion process appears to be delayed. This may be the effect of a phase transition, but requires further study.
Perhaps the additional complexity shown during model development is expected given the need to simplify the combustion process into a ‘layered pyrolysis model’ in the first place, and not being able to apply a more physical decomposition approach, in other words by applying a ‘layer’ versus a ‘cell-by-cell’ modeling approach, whereby each cell of PUF decomposes into TDI and Polyol, then char as its residue.
As a result, it is an undertaking to have the combination of these two models create a realistic representation of the physics involved and produce results that compare favorably with experimental results. In the end a model design was achieved that is characterized by not only its simplicity, but also by its completeness in addressing and explaining the experimentally observed combustion processes. The model’s inherent design simplicity allows it to easily be applied to other burn scenarios with different geometries while being expected to produce accurate burn results.
Conclusion
A multi-layered CFD model is developed using FDS to study the fire behavior of 4-in (10-cm) thick PUF slabs used in many commercial applications. The model predictions compared against real world burn tests demonstrate very good correlation and accurate predictions of the combustion processes prevalent in the burn of polyurethane foams.
The impact of PUF fires is summarized in the following:
- The initial fire behavior of a PUF slab is characterized by the combustion of TDI. Once the TDI is consumed, Polyol will start to combust, creating a large increase in heat release. The flame heights generated during this process are several times higher than the flames generated by the initial TDI burn. This is an important consideration in warehouse scenarios, especially for high-piled rack storage of exposed expanded polyurethane plastics, considered as “Group A Expanded Plastics”.
- Polyol, before it starts to combust, has decomposed to a liquid state and therefore will flow or drip, potentially creating secondary ignition locations and hazards. Effectively it is a heated combustible liquid (with toxic products of combustion).
- While the Polyol burn is relatively short and vigorous, once most of it is consumed, it together with the remaining TDI, continues to burn at lower heat release rates for quite some time and until all PUF is burned off and the fire self-extinguishes.
- Smoke development during TDI burn is less than during Polyol burn, which is when smoke development peaks. It can be expected that visibility near PUF fires will be severely impacted – even shortly after ignition. However, actual impact on visibility and toxicity will depend on the individual room and environmental parameters under consideration.
- PUF fires generate considerable concerns and hazards to life safety, as combusted TDI and Polyol generate highly toxic fumes of oxides of nitrogen and carbon including extremely toxic hydrocarbon compounds, such as hydrogen cyanide.
- Modeling the fire dynamics of burning polyurethane foam slabs is difficult and requires in-depth knowledge of the various decomposition processes and chemical reactions involved.
- The combustion process is characterized by a two-phase decomposition of TDI and Polyol that is complex to simulate. The multi-layered model, accurately predicts the heat release rates during combustion. This is demonstrated by comparisons of the modeling results with results from actual burn tests.
- The simulation results demonstrate the capability of FDS in modeling two-phase combustion processes, and PUF fires in particular.
- Development of this validated model forms the foundation and understanding for engineering analyses to evaluate sprinkler activation times and smoke development for large buildings that contain ceiling obstructions and polyurethane foam areas under fire.
Update: Additional Discussions on Delayed Polyol Combustion
Additional studies were performed in which Polyol (after its decomposition from PUF) combusts without delay (from here on out we will refer to this type of combustion process as “No Delay Polyol Combustion”, NDPC). Curves for simulated heat release rates are compared to curves from experimentally obtained heat release rates. The underlying assumption for this investigation is that the elimination of the delay in Polyol combustion will result in HRR curves that do not exhibit all of the delay effects as displayed in Figure 3 during the periods 110 – 180 sec and 250 – 320 sec.
For the purpose of simulating NDPC, only numerical terms relating to the delay in the Polyol combustion process are adjusted, while all other model parameters remain the same. The Polyol combustion delay of the previously discussed model (shown in Figure 3 and referred to as the model with Delayed Polyol Combustion, DPC) is defined to represent 100% of reference delay. Based on this reference, an additional simulation was performed with a 50% delay in Polyol combustion (50% DPC). Again, all other model parameters used in this additional simulation remained unchanged. The objective of this second simulation is to demonstrate the gradual effect of Polyol combustion delays on the overall HRR of PUF under fire.
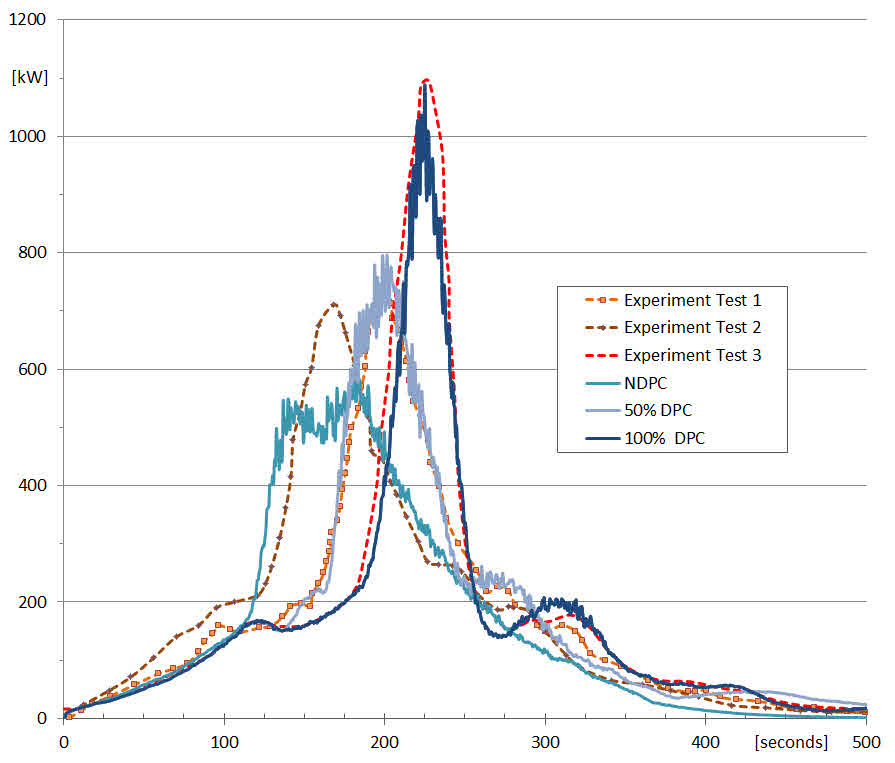
Figure 6. Comparison of HRR Curves With Various Polyol Combustion Delays
Discussion
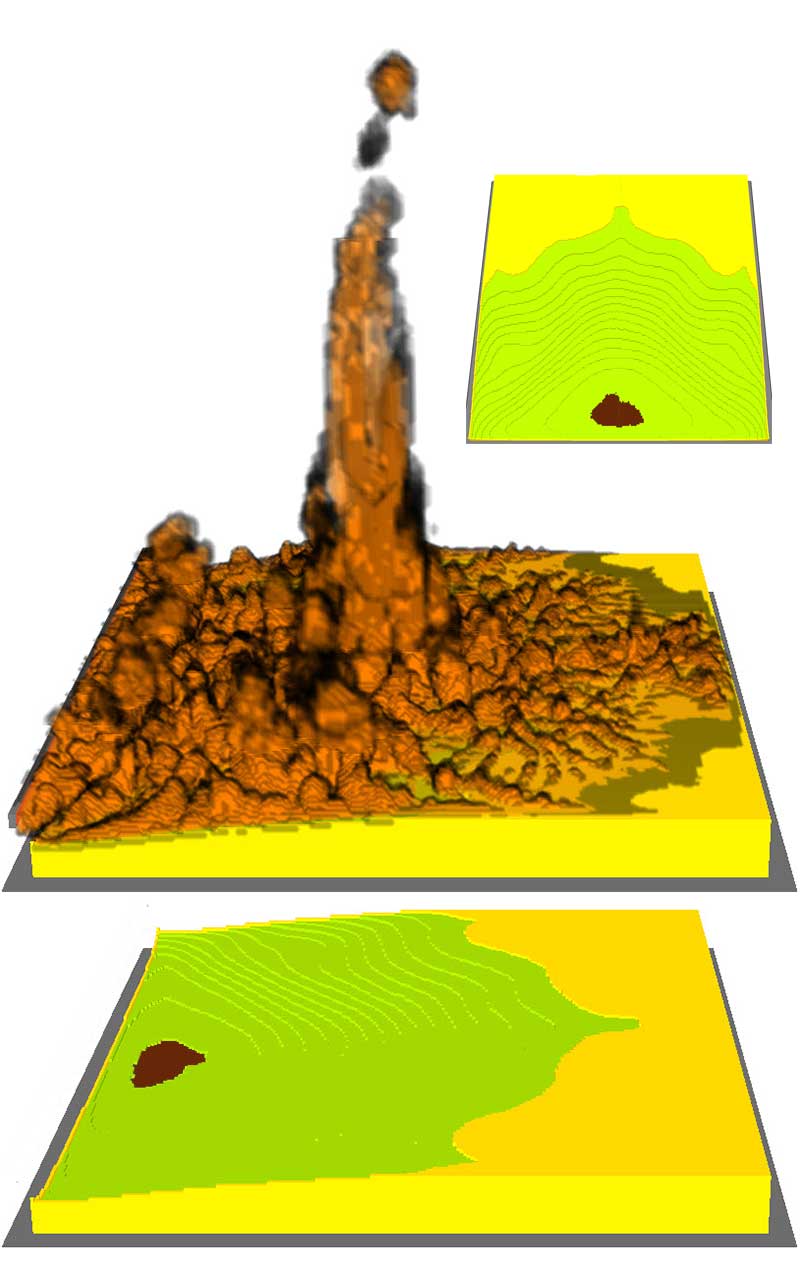
Figure 7. Oblique views of contour lines of PUF decomposition at start of Polyol burn (top and bottom images, Polyol surface area under combustion colored brown). Middle image: oblique view of burn at the same time index (approx. 120 seconds), but with flame fronts added.
(Click to Zoom)
During the TDI Combustion Phase, curves tracking the NDPC heat release rates run parallel to the curves tracking heat development simulated by the DPC model, as shown in Figure 6. This observation should not come as a surprise due to the fact that only TDI is combusting during this phase and all of its material and combustion parameters remained unchanged among the models. As discussed before, once some of the TDI is completely combusted, a melt pool begins to form at the bottom of the pan (Figure 7). Once the melt layer is formed, the NDPC simulation predicts the immediate combustion of Polyol and an immediate release of all of its available chemical energy. Maximum heat release rates reach approximately 580 kW.
When compared to actual burn tests, it is seen that overall NDPC burn characteristics correspond rather poorly to the burn characteristics of the NIST fire test #2, its closest match out of all the fire tests. However, the 50% DPC simulation shows a much better correlation with the experimental fire tests overall and the NIST fire test #1 in particular.
Polyol combustion delays will significantly impact the maximum heat release rates that are observed. This is exemplified by the results for HRR from simulations and their correlation with fire tests i.e., observed peak heat release rates are approximately 580 kW (NDPC), 790 kW (50% DPC), and 1,100 kW (100% DPC, reference delay).
Polyol combustion delays across the PUF slab for the 100% DPC simulation case may be visualized with the help of a 3D map, Figure 8. It must be noted, however, that it is difficult to create accurate representations of the combustion delays given the unknown nature of their causes. In an approximation to simulate the actual combustion delays, an additional Polyol layer with a lower burn rate and varying thicknesses across the plane of the slab was applied. Simulated Polyol delay patterns are based on changes in (localized) TDI mass-loss across the PUF slab during combustion.
The different thicknesses across the additional layer will cause the exposed, uniform Polyol layer to fully combust at specific delays across the slab. In effect, the resulting time delays will follow the thickness distribution applied in the additional layer. The Polyol mass used in the additional layer was taken from the total Polyol mass budget.
Hypothesis
If we focus on the fire dynamics of Polyol combustion and ignore, for the sake of brevity, the impact of ventilation scenarios, the following hypothesis can be made: The total heat released by PUF and governed by Polyol combustion is influenced by the size of the surface area under full combustion of Polyol in the melt pool. An effective melt layer area is defined and serves as the main contributor to high heat release Polyol combustion. This effective melt layer area is governed by:
(1) The PUF decomposition rate or Polyol creation rate
(2) The Polyol depletion rate
It should be noted that the Polyol depletion rate is also a function of the Polyol combustion delay. Let us further clarify these contributors and discuss their relationship. If Polyol already begins to fully combust over a significant area, while much of the available Polyol is still being created (NDPC case), then this will reduce peak PUF heat release rates that occur later on in the burn process. However, this will happen only if the remaining Polyol volume (fuel load) of this early-phase combustion is insufficient to sustain continued combustion until peak HRR is observed.
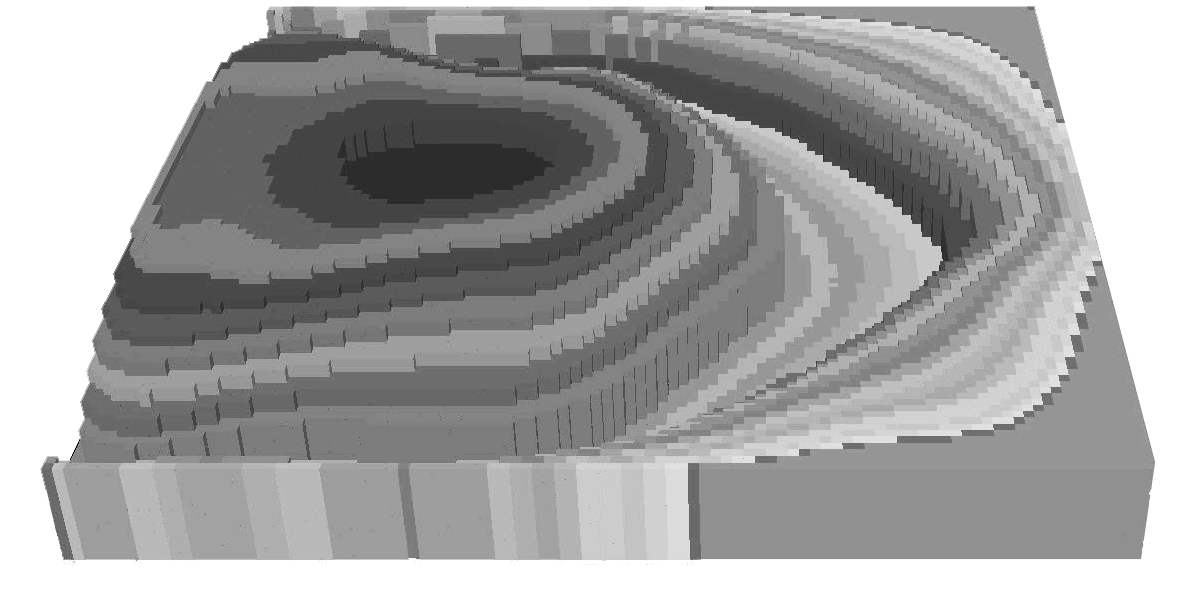
Figure 8. Simulated Polyol Delay Pattern (Burner Located Along Left Hand Side Edge).
(Click to Zoom).
In other words, if in this case it can be assumed that there is virtually no flow of liquid Polyol given Polyol’s viscosity, the presumed relatively high contact angles of the liquid-substrate interface, and the relatively thin melt layer based on the test specimen’s limited thickness and horizontal orientation, then the “localized volume” of early-phase combusting Polyol will be reduced to such an extent that there will be very little material left to combust and thus contribute heat during the late phase combustion of the remaining Polyol. This condition represents a localized “burnout” of Polyol. As a result, the effective melt layer surface area in the Polyol burn is reduced.
The effect of this localized burnout on HRR may be seen from the NIST fire test #2 and test #4 of Figure 1. On the other hand optimal heat release rates will occur, if Polyol combustion delays meet the following conditions: (a) the surface area of the melt pool is at its maximum possible size for a given specimen geometry with (b) a sufficient melt layer depth (fuel load) to sustain full combustion over a long enough time to reach peak HRR. The result of this effect on HRR is demonstrated in Figure 3.
Summary
From these simulations and comparisons to the burn results of the actual fire tests, it is concluded that Polyol will combust after decomposition with some level of delay before its full chemical energy is released. The fire tests have demonstrated that the amount of delay can vary among PUF burns even when using test specimens from the same batch of PUF foam1. The causes for these combustion delays are unknown.
We hope that these additional explanations and details about Polyurethane based foam materials under combustion will answer more questions than they create. We are confident that many of the insights discussed here should also hold for other PUF fire scenarios, such as center-ignited versus edge-ignited PUF combustion processes. Perhaps most importantly we welcome any effort in furthering the understanding of PUF combustion. It is an ongoing area of research that seems to grow only more important as time progresses, so any valuable insights that others can share would be welcomed.
References:
[1] “NUMERICAL SIMULATION OF FIRE SPREAD ON POLYURETHANE FOAM SLABS” Prasad, K. R.; Kramer, R.; Marsh, N.; Nyden, M. R., Fire Research Division , NIST, Gaithersburg, 2009